Understanding PotentioStat( ECM ) - Understanding Potential circuit (Principle of PotentioStat)
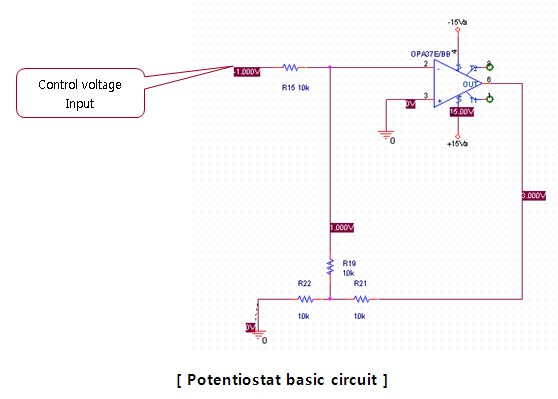
Electronic circuit is bound to be unfamiliar to electro-chemical majors. The purpose of this course is to provide a brief understanding of PotentioStat and QCM by other majors(not electrical, electronic majors) who want to conduct electro-chemical experiments. This PotentioStat is one of the most popular uses in electrochemistry. Also known as Potentiostat, it is also called ECM in the head office. The definition of Potentiostat is a circuit that maintains a constant voltage. That does not mean that they always maintain a constant voltage, but circuits that maintain a constant voltage proportional to the voltage input by the user. For that there must be a Feedback and the circuit which is used a lot is shown below.

In the figure below, the areas shown in light blue are those for which the solution is intended, but they are shown as resistance for now. In advance, it is easy to observe the flow of current through resistance and then convert it into a solution to explain it. If you put the voltage into the area known as the Input Voltage of PotentioStat as shown in the left figure, Following the green line in the figure below, a current in proportion to the voltage flows. The main current is the green line and the purple is the Feedback current to maintain the Potential. ( Since the input impedance of the Opamp is large, it rarely flows. )
Figures with the actual analysis target can be expressed as follows. In PotentioStat, the analysis target is connected to the circuit(not the resistance). The way to connect it is the electrode. A constant voltage is maintained at both end of the electrode, so current flows like a green line. When resistance is connected, the current is proportional to voltage, but when a solution is connected, there are many forms depending on the substance. This means that there is not a current curve which is necessarily proportional to the voltage, and that it tends to vary depending on the analysis target. In this way, the waveform shown is shown in the figure on the below, left. and showing the X-axis as the voltage axis results in the Cyclic Voltametry curve in the figure on the right. The picture of the Voltametry changes according to the resistance (concentration) of the solution as shown below.
|